Setting emissions reduction targets is a central element of corporate carbon accounting. Once a company has calculated its greenhouse gas (GHG) emissions—typically across Scope 1 (direct emissions), Scope 2 (indirect emissions from purchased energy), and, where relevant, Scope 3 (value chain emissions)—the next step is to define how these emissions will be reduced over time. This process is commonly referred to as target setting.
Target setting ensures that emissions management is not only reactive, but aligned with long-term planning. It provides a structured framework for defining reduction pathways, assigning responsibilities, tracking progress, and meeting internal or external requirements.
Depending on the company’s context, targets may be set voluntarily (e.g. in response to stakeholder expectations), or in compliance with specific frameworks such as:
The Science Based Targets initiative (SBTi), which offers a globally recognized standard for climate targets aligned with the Paris Agreement, and
The Corporate Sustainability Reporting Directive (CSRD), which requires many EU-based companies to disclose climate targets and transition plans in their sustainability reporting.
This article outlines what target setting in carbon accounting involves, what requirements apply under SBTi and CSRD, and how companies can approach the process in a structured and compliant way by using the EQS Sustainability Cockpit.
Background and Basics
1. General Structure of Target Setting
Emissions reduction targets typically define:
A base year (the reference year for emissions),
A target year (e.g. 2030 or 2050),
The percentage reduction to be achieved,
The scope of emissions covered (Scope 1, 2, and/or 3).
Targets should be:
Quantifiable (e.g. “reduce Scope 1 and 2 emissions by 50% by 2030”),
Time-bound, and
Based on a consistent methodology (e.g. the GHG Protocol).
Target setting is only meaningful if it follows a reliable GHG inventory and is integrated into internal decision-making, operations, and reporting.
2. Requirements under the Science Based Targets Initiative (SBTi)
The Science Based Targets initiative (SBTi) provides methodologies for aligning corporate targets with global climate goals.
Key Requirements:
Scope coverage: Targets must include Scopes 1 & 2. Companies with Scope 3 emissions > 40 % must set Scope 3 targets too, covering at least 67 % of these emissions.
Ambition level: Targets must align with keeping warming to 1.5 °C, with net-zero by 2050. Near-term targets need 95 % Scope 1 & 2 coverage, and net-zero goals require 90 % of Scope 3 emissions addressed.
Net-zero standard: Requires credible long-term pathways, reliance on removals only for residual emissions, and comprehensive value chain action.
Offset use: Only residual emissions may be offset post-reductions; widespread use of credits is discouraged.
Revision cycle: Targets must be submitted for validation and re-assessed every 5 years, aligning with scientific updates
3. Requirements under the Corporate Sustainability Reporting Directive (CSRD)
The CSRD requires large and listed EU companies to report on sustainability matters, including climate change, under the European Sustainability Reporting Standards (ESRS).
Key Requirements:
Disclosure of climate targets:
At least one GHG reduction target covering Scope 1 and 2 is required.
If material, companies must also disclose Scope 3 targets.
Targets must be aligned with the 1.5 °C goal where feasible.
Transition plan:
Must describe how the company intends to achieve climate targets.
Includes KPIs, timelines, budget allocation, and governance responsibilities.
Double materiality:
Companies must assess both how climate change affects their business (financial materiality) and how their business affects the climate (impact materiality).
Governance and accountability:
Climate targets must be integrated into company strategy and overseen by top management.
Reporting format:
Data must be reported in a machine-readable format (XHTML/XBRL).
Limited assurance by a third-party auditor is required.
Step-by-Step Process
1. Checklist for Target Setting
✅ Conduct a complete emissions inventory (Scope 1, 2, and 3 if relevant) using GHG Protocol.
✅ Define a base year with reliable data as a reference point.
✅ Set quantifiable, time-bound targets (e.g. “reduce Scope 1 and 2 by 50% by 2030”).
✅ Define Measures to reach you targets. More on Measures ans Scenarios here.
✅ Track progress annually, adjust as necessary, and disclose in sustainability reporting
Target name
Write a clear label such as “Scope 1 and 2 net zero 2035”.
Baseline report
Select a completed CO₂ report from the drop-down.
The tool auto-fills the baseline emissions for the scopes you choose.
Your base year must be clearly documented and targets must be recalculated if there are significant structural changes (>5% impact on emissions)
Scope selection
Define wicht Scopes should be included.
Tick Scope 1, Scope 2 and/or Scope 3.
For Scope 2 you can tick market based, location based or both.

Start date and end date
Set the first year of tracking and the year when the goal must be met.
Annual growth rate (Business-as-Usual)
Enter you expected annual growth in percentage between 0 and 100.
The tool uses this figure to draw a business-as-usual (BAU) line, to display your expected emissions without any reduction measures in place.
Emission Reductions Plan
Choose Nominal value for an absolute tonne or percent cut.
Choose Intensity based value to link emissions to revenue, headcount or another indicator.
Important:
Intensity targets (e.g. per product or per revenue) are not accepted under CSRD or SBTi for Scope 1 and 2.
SBTi only allows intensity-based targets under specific cases for Scope 3, and even then only with justification and alignment to reduction pathways.

If you pick intensity, fill in the indicator name and its baseline value.
Enter the yearly Reduction rate. The field accepts any figure between 0 and 100 percent.
- SBTi-aligned annual reduction rate (absolute) define an absolute reduction of at least 4.2% per year for Scope 1 and 2 to stay on a 1.5 °C pathway.
- Target outcome (absolute) should usually be pproximately 50% total reduction over 10 years from the base year.
Confirm
Press Confirm to save the target. It now appears in the Targets list and feeds the analytics dashboard.
8. Understanding the target dashboard
In the Scenario graphs tab inside Targets, everything answers one question: Are we on track to hit the goal?
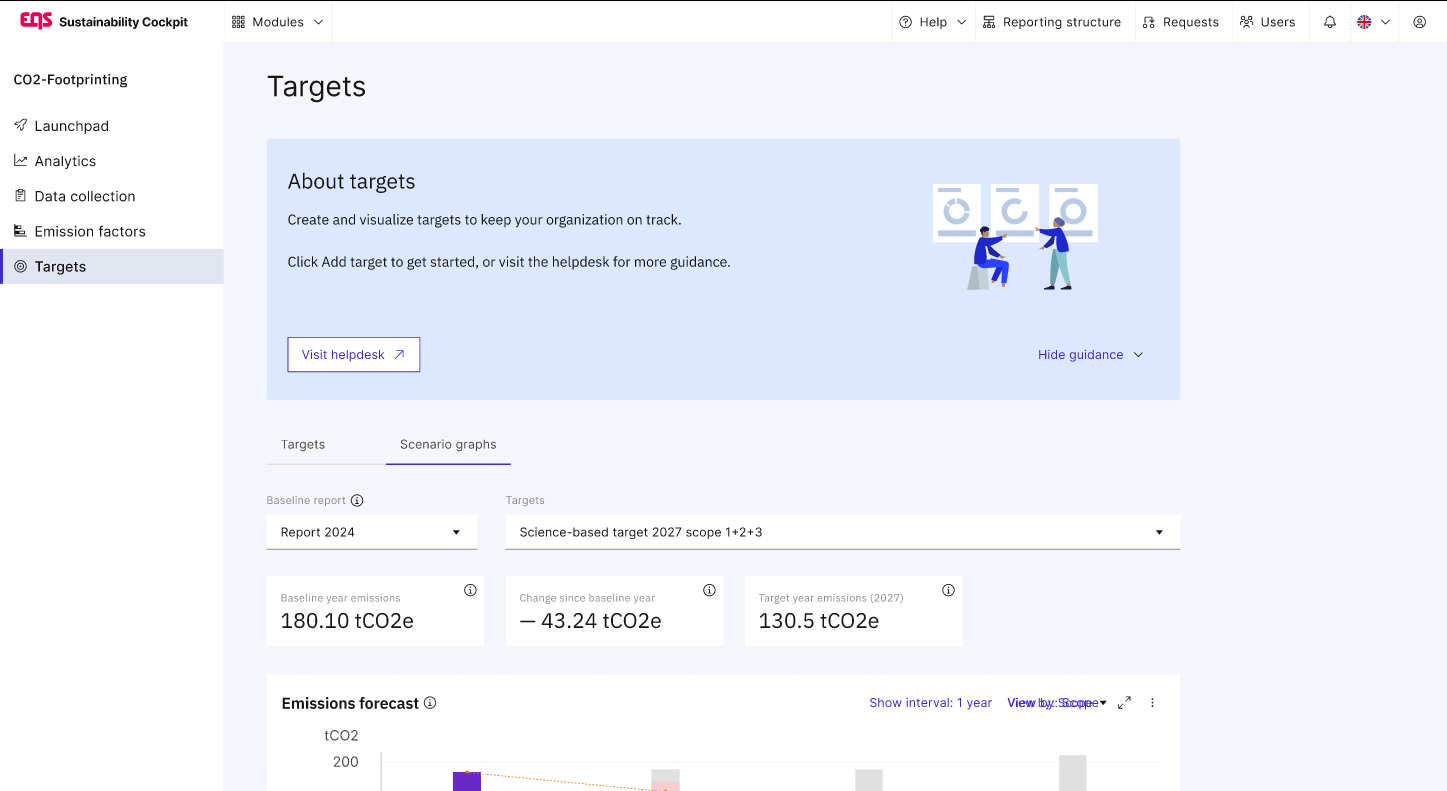
| Element | What it shows | How to use it |
|---|---|---|
| Baseline report picker | Which footprint report supplies the starting numbers. | Switch reports if you re-baseline after an inventory update. |
| Target picker | The specific target pathway you are viewing. | Select another target to see its own dashboard. |
| Summary tiles | • Baseline year emissions in tonnes CO₂e. • Change since baseline year already achieved (negative means a cut). • Target year emissions allowed at the goal year. | Quick health check. A large negative change shows early progress. |
| Emissions forecast chart | Stacked bars by year in purple, blue and teal for Scopes 1 to 3. Grey bars mark the business-as-usual line. A dotted orange line plots the target pathway. A small green flag pins the end-year target value. | Watch if coloured bars rise above the dotted line. Pink shading flags any overshoot. |
| Show interval | Lets you switch the x-axis between one-year and multi-year steps. | Use five-year steps for long horizons to declutter the view. |
| View by | Toggle between Scope and Source category breakdowns. | Choose the view that matches your reduction focus. |
| Scope breakdown table | Numeric detail for the highlighted year, listed by scope. | Hover over a bar to update the table and see exact tonnes. |

How to interpret the chart quickly
Trend versus line
If the coloured bars stay under the dotted orange line the target is on track.Gap spotting
Pink segments above the line show how much you must still cut.BAU comparison
The grey bar reveals what emissions would be without measures, making the benefit visible. Read more about BAU in this article.Scope focus
Use the legend or the table to see which scope dominates in any given year. That is where new measures will have the biggest impact.
By checking these visual cues each reporting period you can tell at a glance whether the organisation is ahead of schedule, drifting, or needs extra measures to close the gap.
Summary:
Baseline line: Marks the starting emissions for each chosen scope.
Target line: Shows the straight path from baseline to the end-date goal.
Business-as-usual line: Uses the growth rate to display emissions with no action.
Actual points: Each yearly report adds a dot so you see progress in real time.
Gap alerts: When actual emissions sit above the target line, the dashboard highlights the difference and suggests a review of measures.
Was this article helpful?
That’s Great!
Thank you for your feedback
Sorry! We couldn't be helpful
Thank you for your feedback
Feedback sent
We appreciate your effort and will try to fix the article